
Data needs meaning, not just graphs
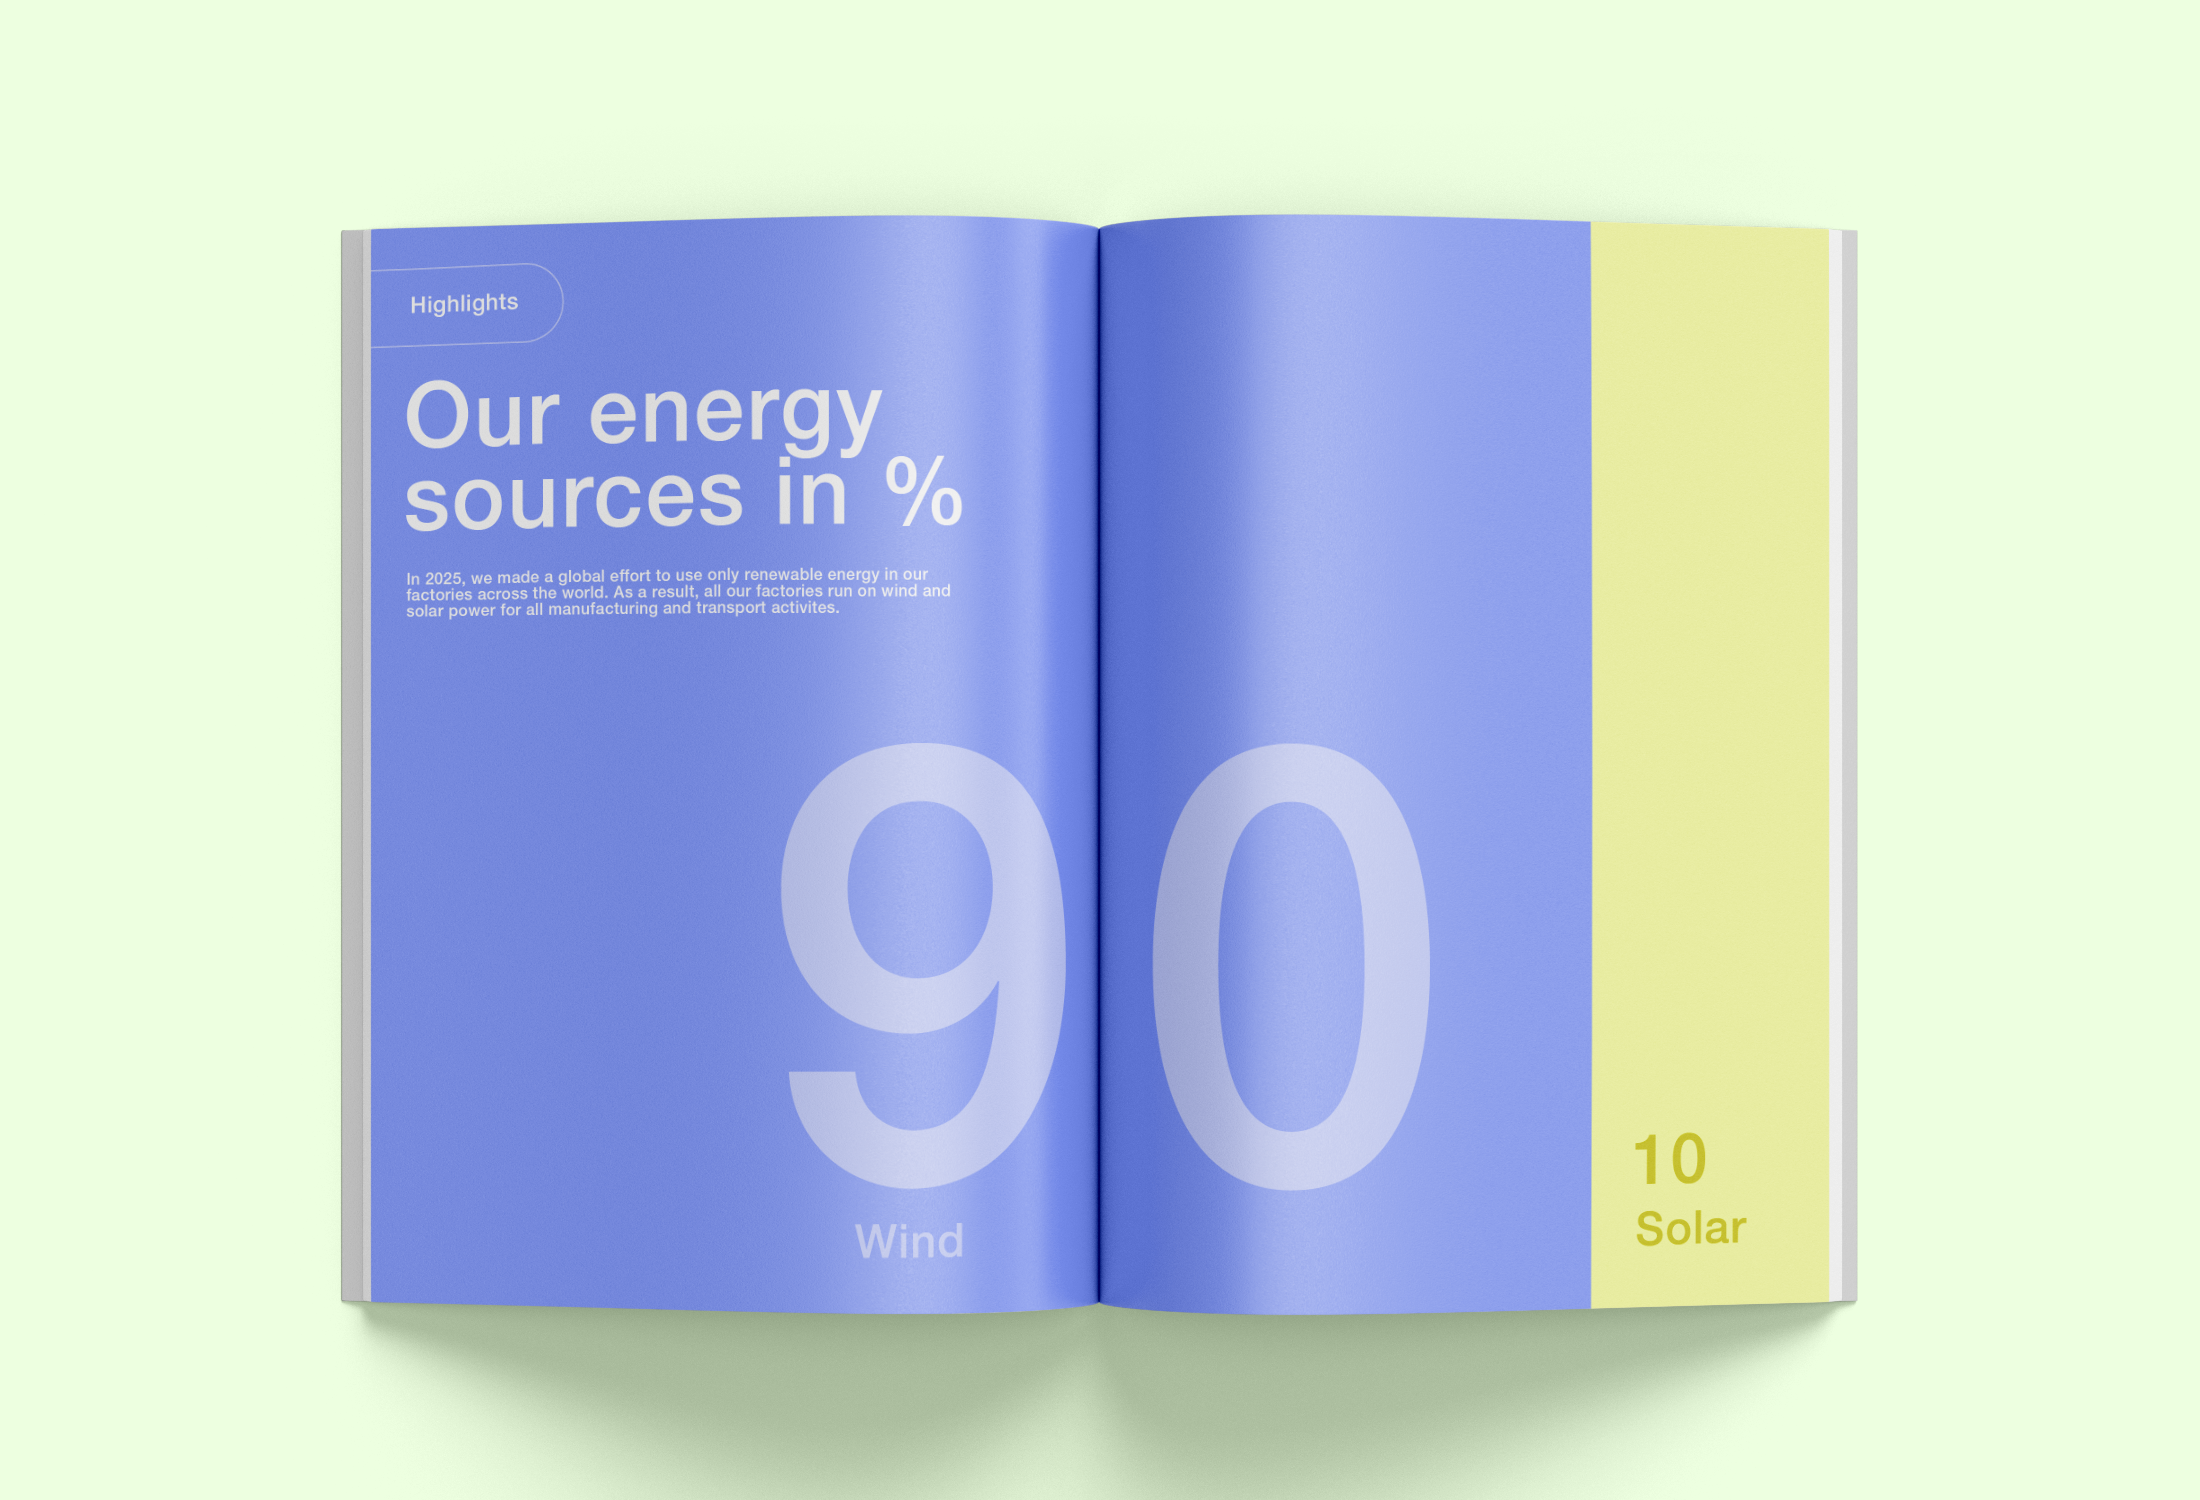
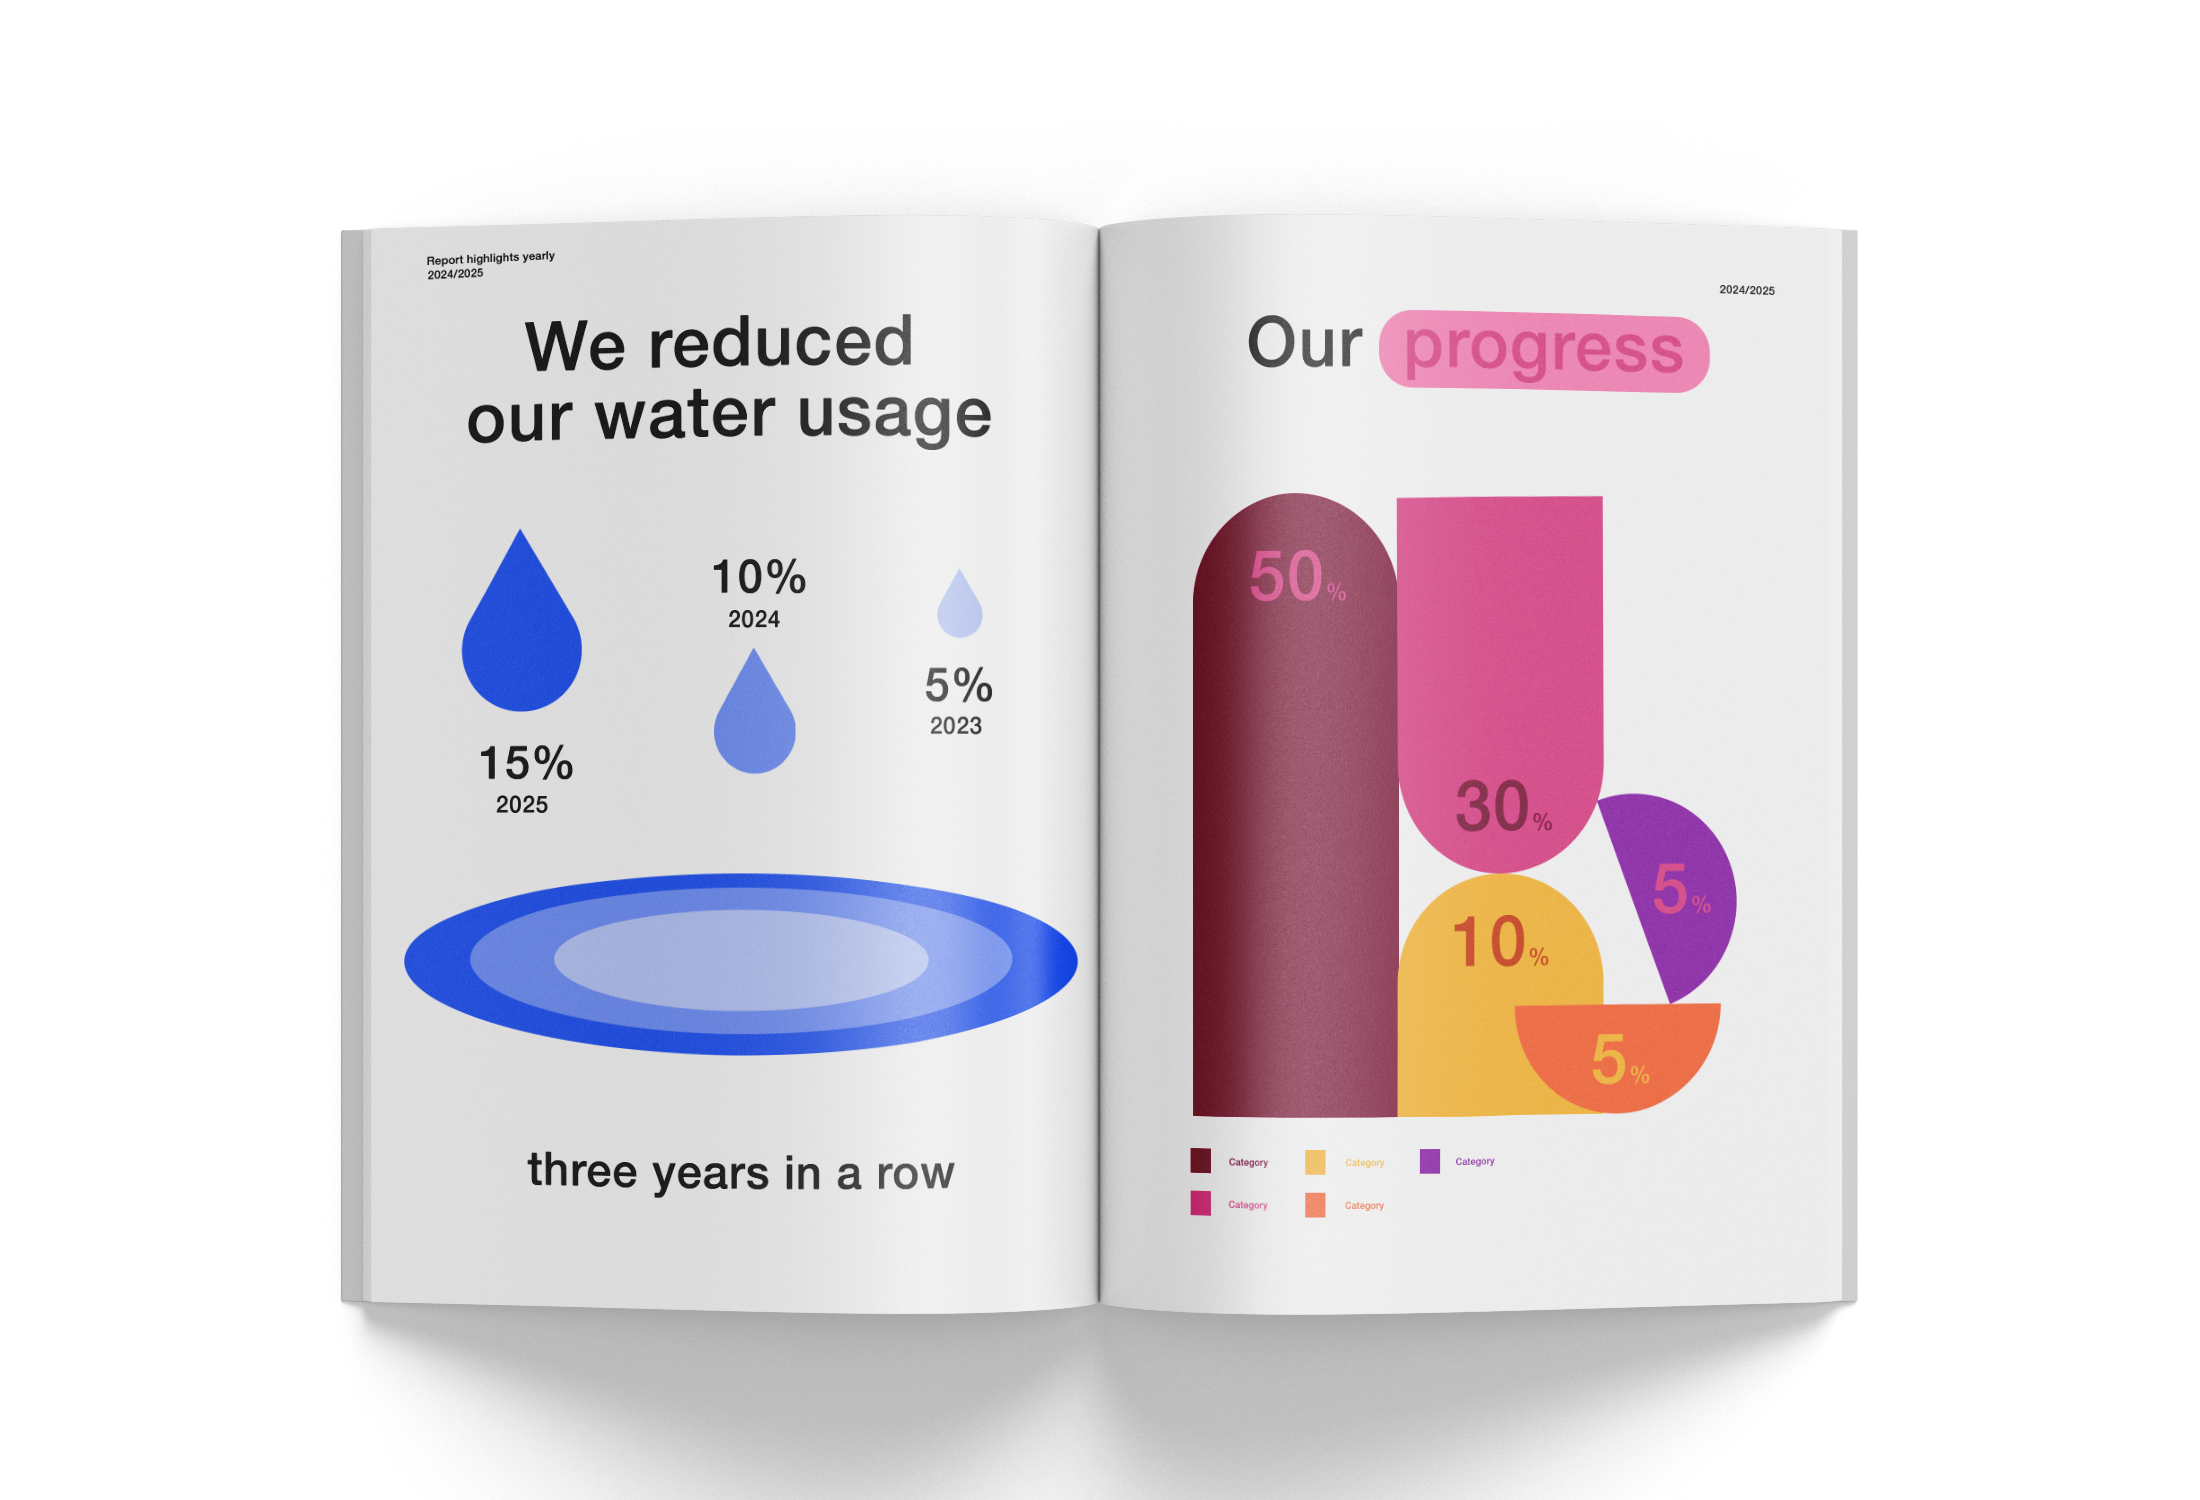
When we think about data visualization, most of us picture the usual suspects: bar charts, line graphs, pie charts. They’re familiar, safe, and widely used. But data doesn’t have to look like that — and more importantly, it doesn’t have to stand alone.
Seeing a screen full of numbers or a technically correct chart doesn’t automatically lead to understanding. Without context, data is just information. It tells us what, but not why it matters. A graph showing growth, decline, or comparison is only useful if we understand what those numbers mean for the situation, the people involved, or the decisions that need to be made.
This is where many data presentations fall short. We assume the data will speak for itself. But it rarely does — especially when the audience isn’t made up of analysts or data specialists. For non-expert audiences, too many numbers without explanation can feel overwhelming or even alienating. Instead of clarity, we create distance.
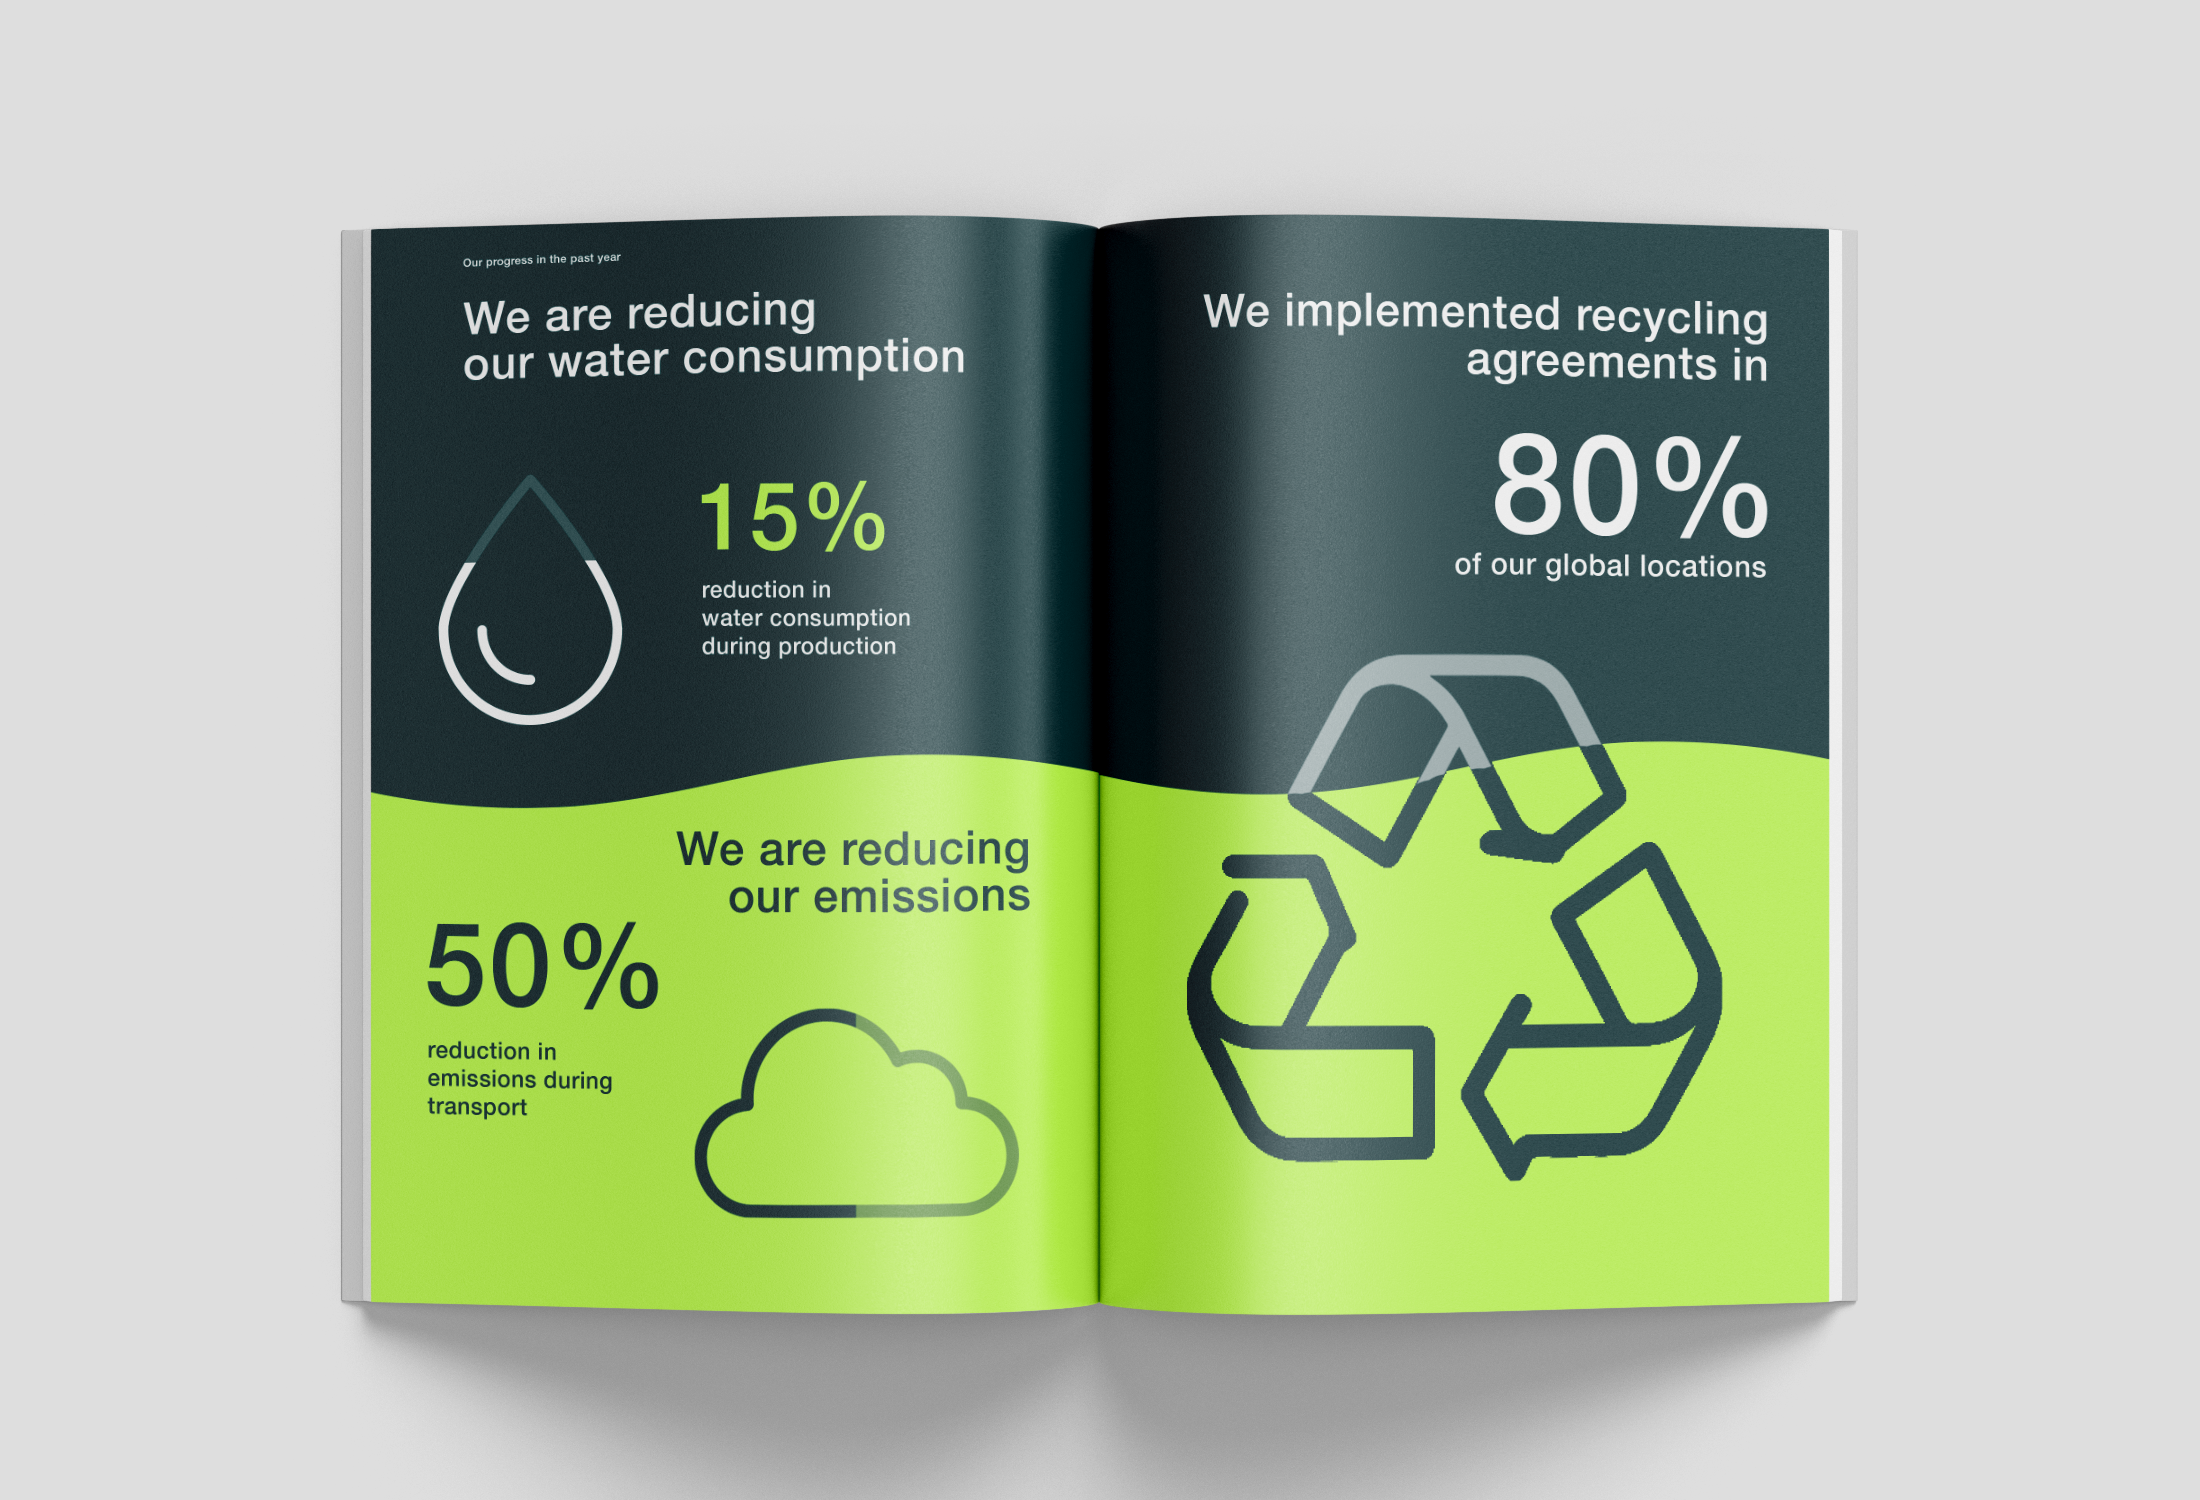
Good data visualization brings numbers together with context and meaning. It connects data to a story, a question, or a real-world implication. What changed? Compared to what? Why should the audience care? When those questions are answered, data becomes useful — and persuasive.
There’s also far more room for creativity in data visualization than we often allow ourselves to explore. Visual metaphors, illustrations, thoughtful color use, layout, and hierarchy can all help guide attention and make insights clearer. Creativity doesn’t mean sacrificing accuracy; it means designing with intention. When done well, creative data visualization makes information more approachable, more memorable, and more engaging.
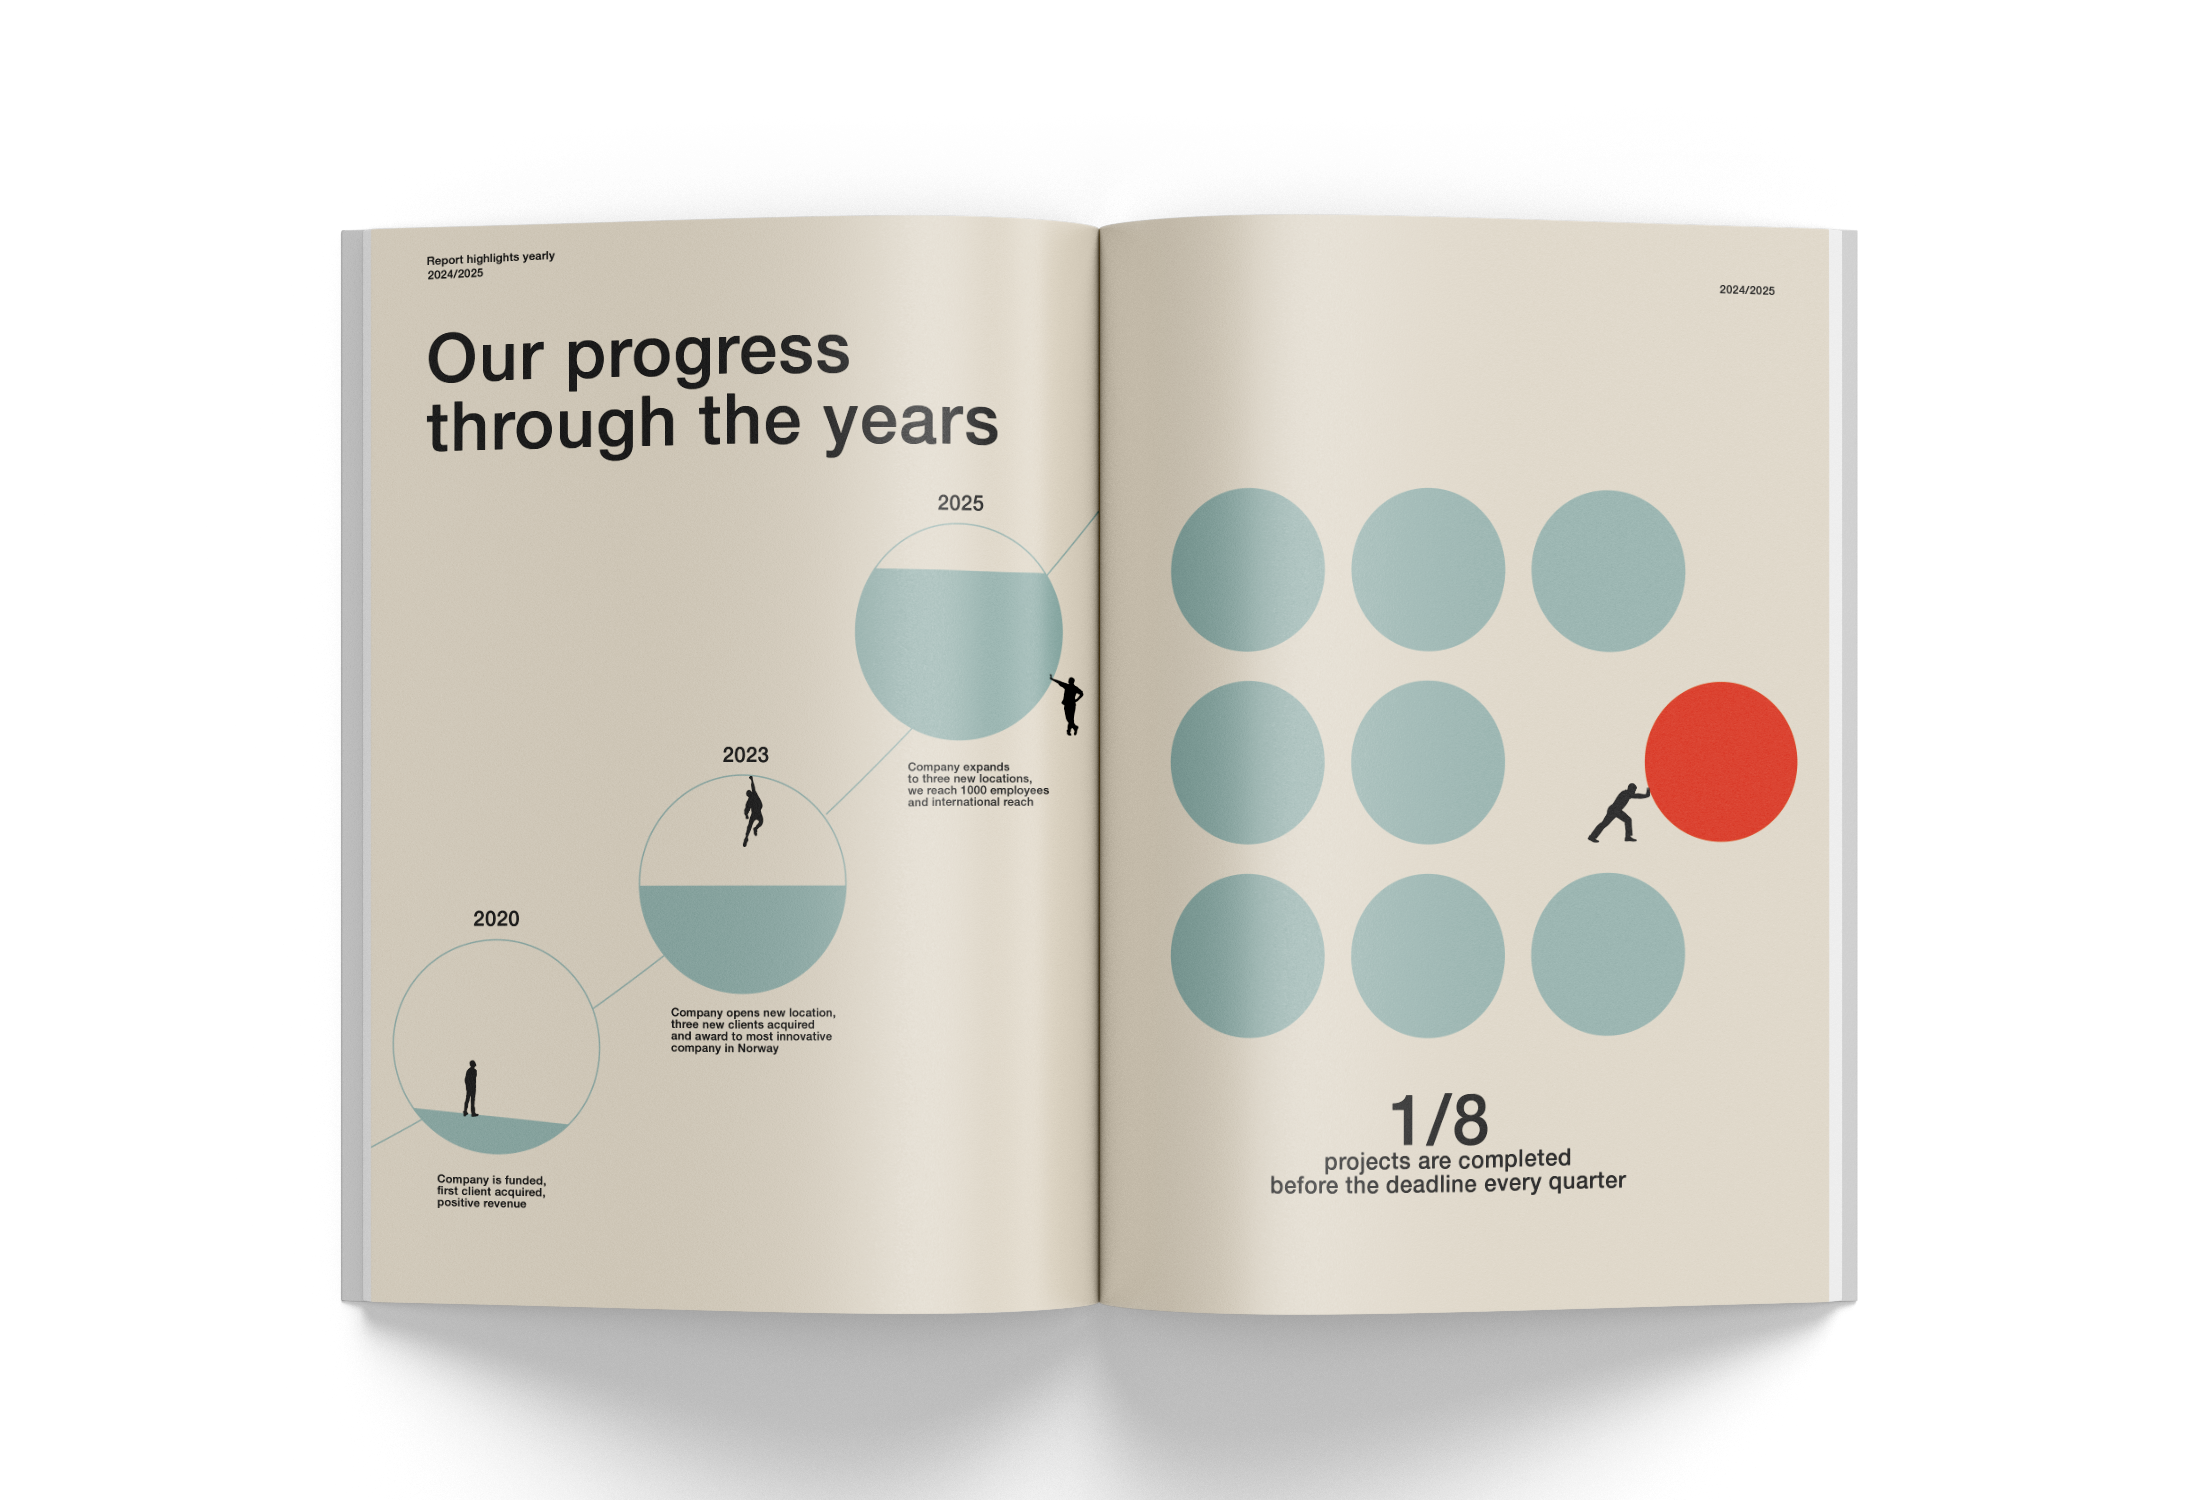
This is especially important when communicating with audiences who don’t live and breathe data. A creative, well-contextualized visual can help people grasp complex ideas quickly, without needing technical expertise. It invites curiosity instead of intimidation.
In the end, the goal of data visualization isn’t to show how much data you have. It’s to help people understand something — and ideally, to help them act on it. When numbers are paired with context, meaning, and a touch of creativity, data stops being noise and starts becoming communication.
Do you need help visualizing data in your next report or social media post? Reach out for an informal chat!